
CHARM™ contains a wide variety data for your community.
CHARM™ pulls together data from local, state, and federal sources to support meaningful dialogue about vision and values for the future. We overlap these data sets and let users apply hypothetical land development styles on them.
See below for more data layer information.

PLACES
City, county, and state lines are used to identify jurisdiction and municipalities.

CRITICAL FACILITIES
Critical facilities include public services and other major utilities that might be vulnerable to natural hazards.

HURRICANE TRACK
These show the past 120+ years worth of tracking hurricane or tropical storm data.


Major roads and interstates under the local, state, and federal classification.
This grid is CHARM’s unit of analysis. Holding over 20 core attributes about land characteristics in the grid, and another 100 indicators once a scenario is created.
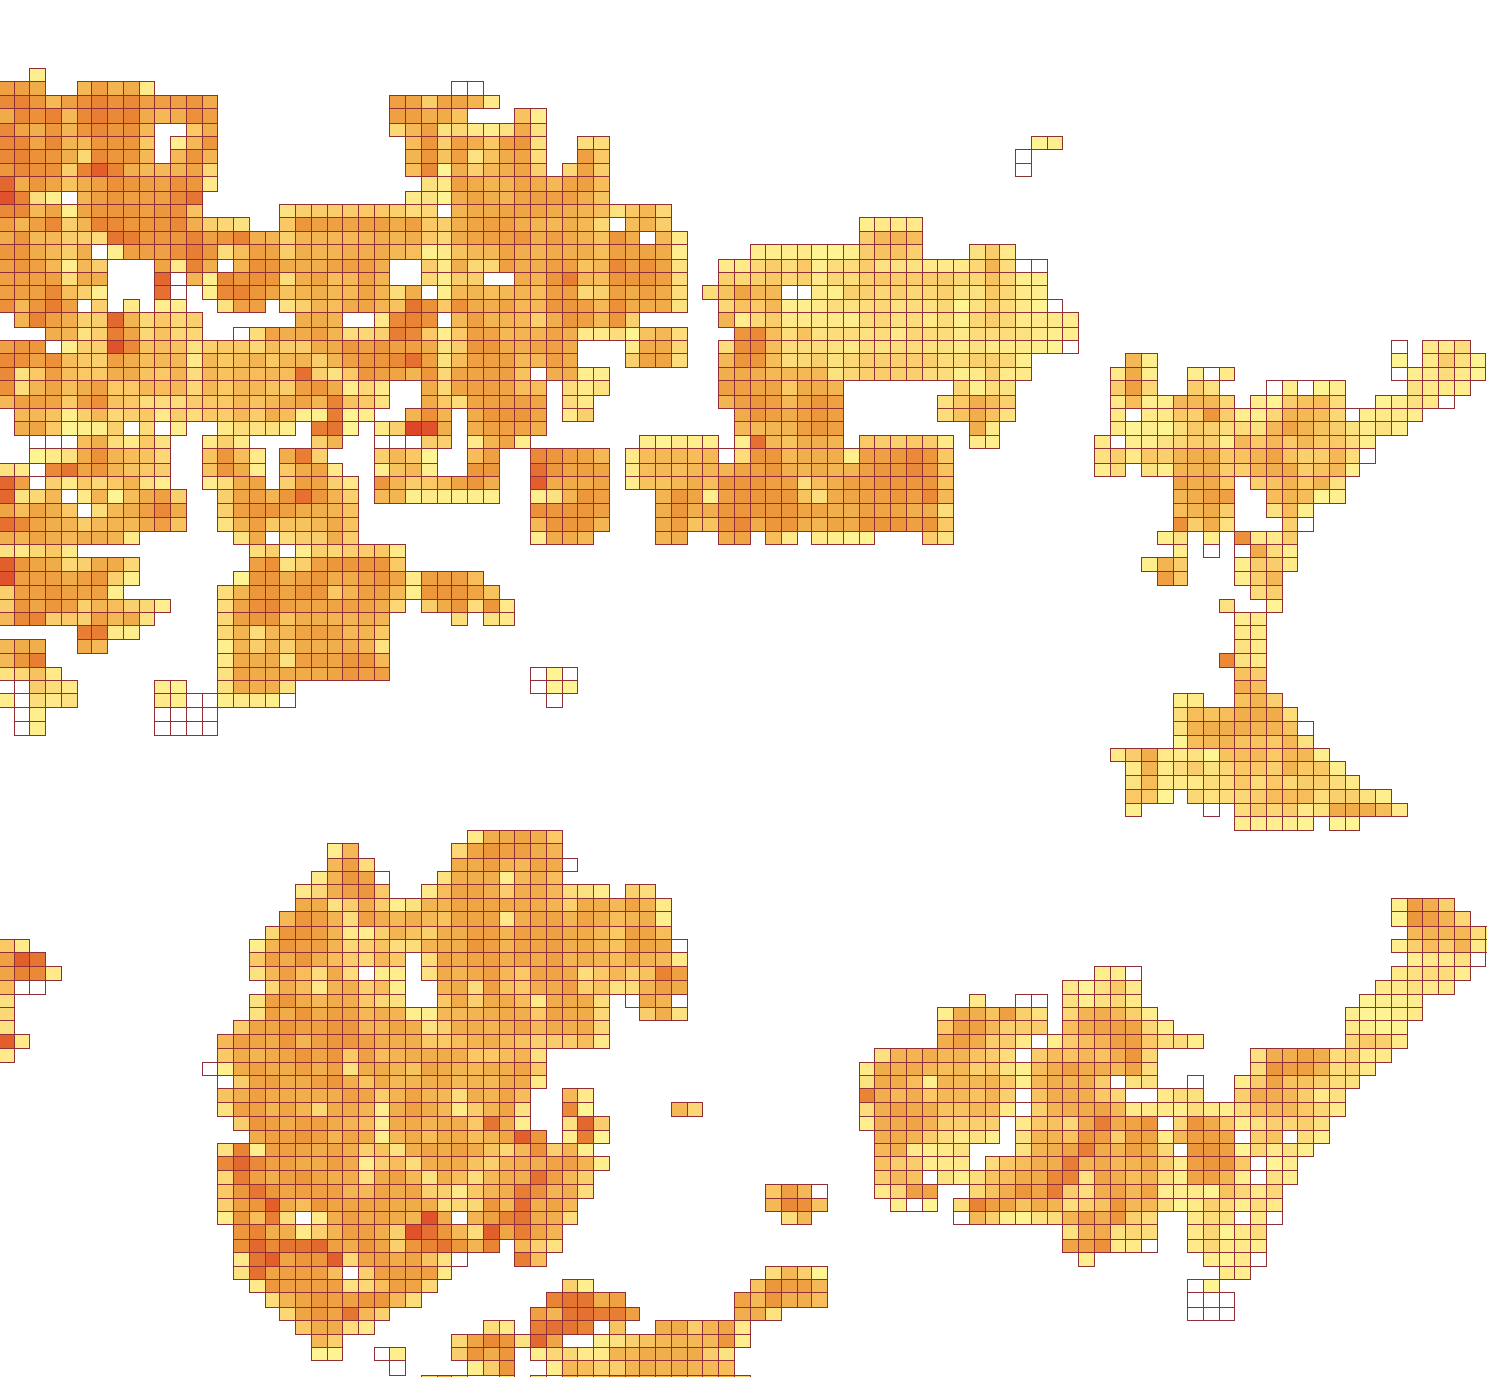
CHARM’s data approximates how many people reside in every square on the grid, via census and parcel data.

DEMOGRAPHICS
Gathering demographic data for age, income, and family size.

SOCIAL VULNERABILITY
More demographic indicators that display a specific population’s capacity to respond to natural disaster.

ELEVATION
Elevation is a key geographical component, particularly with coastal hazards.


BFE displays flood depth at certain points.
Floodways are the highest risk sections of rivers. It’s imperative for planning to know where these are.
The Flood Insurance Rate Map displays insurance zones based on 100 year or 500 year risks.

FLOOD DEPTH GRIDS
Within this grid shows flood depths for 100 to 500 year events.

HABITAT
Identifying environmental and other sensitive habitat data in local communities.

PARCEL
Contact Local Appraisal District
Parcel data assists with understanding land use activity by specific locations.


Land Cover marks the intensity of coverage in our communities, such as impervious surface covers.
Soils displays prime farmland areas, septic system drainage, and shrink-swell potential.
Since everyone lives in a watershed, it’s important for understanding how development impacts stormwater issues.

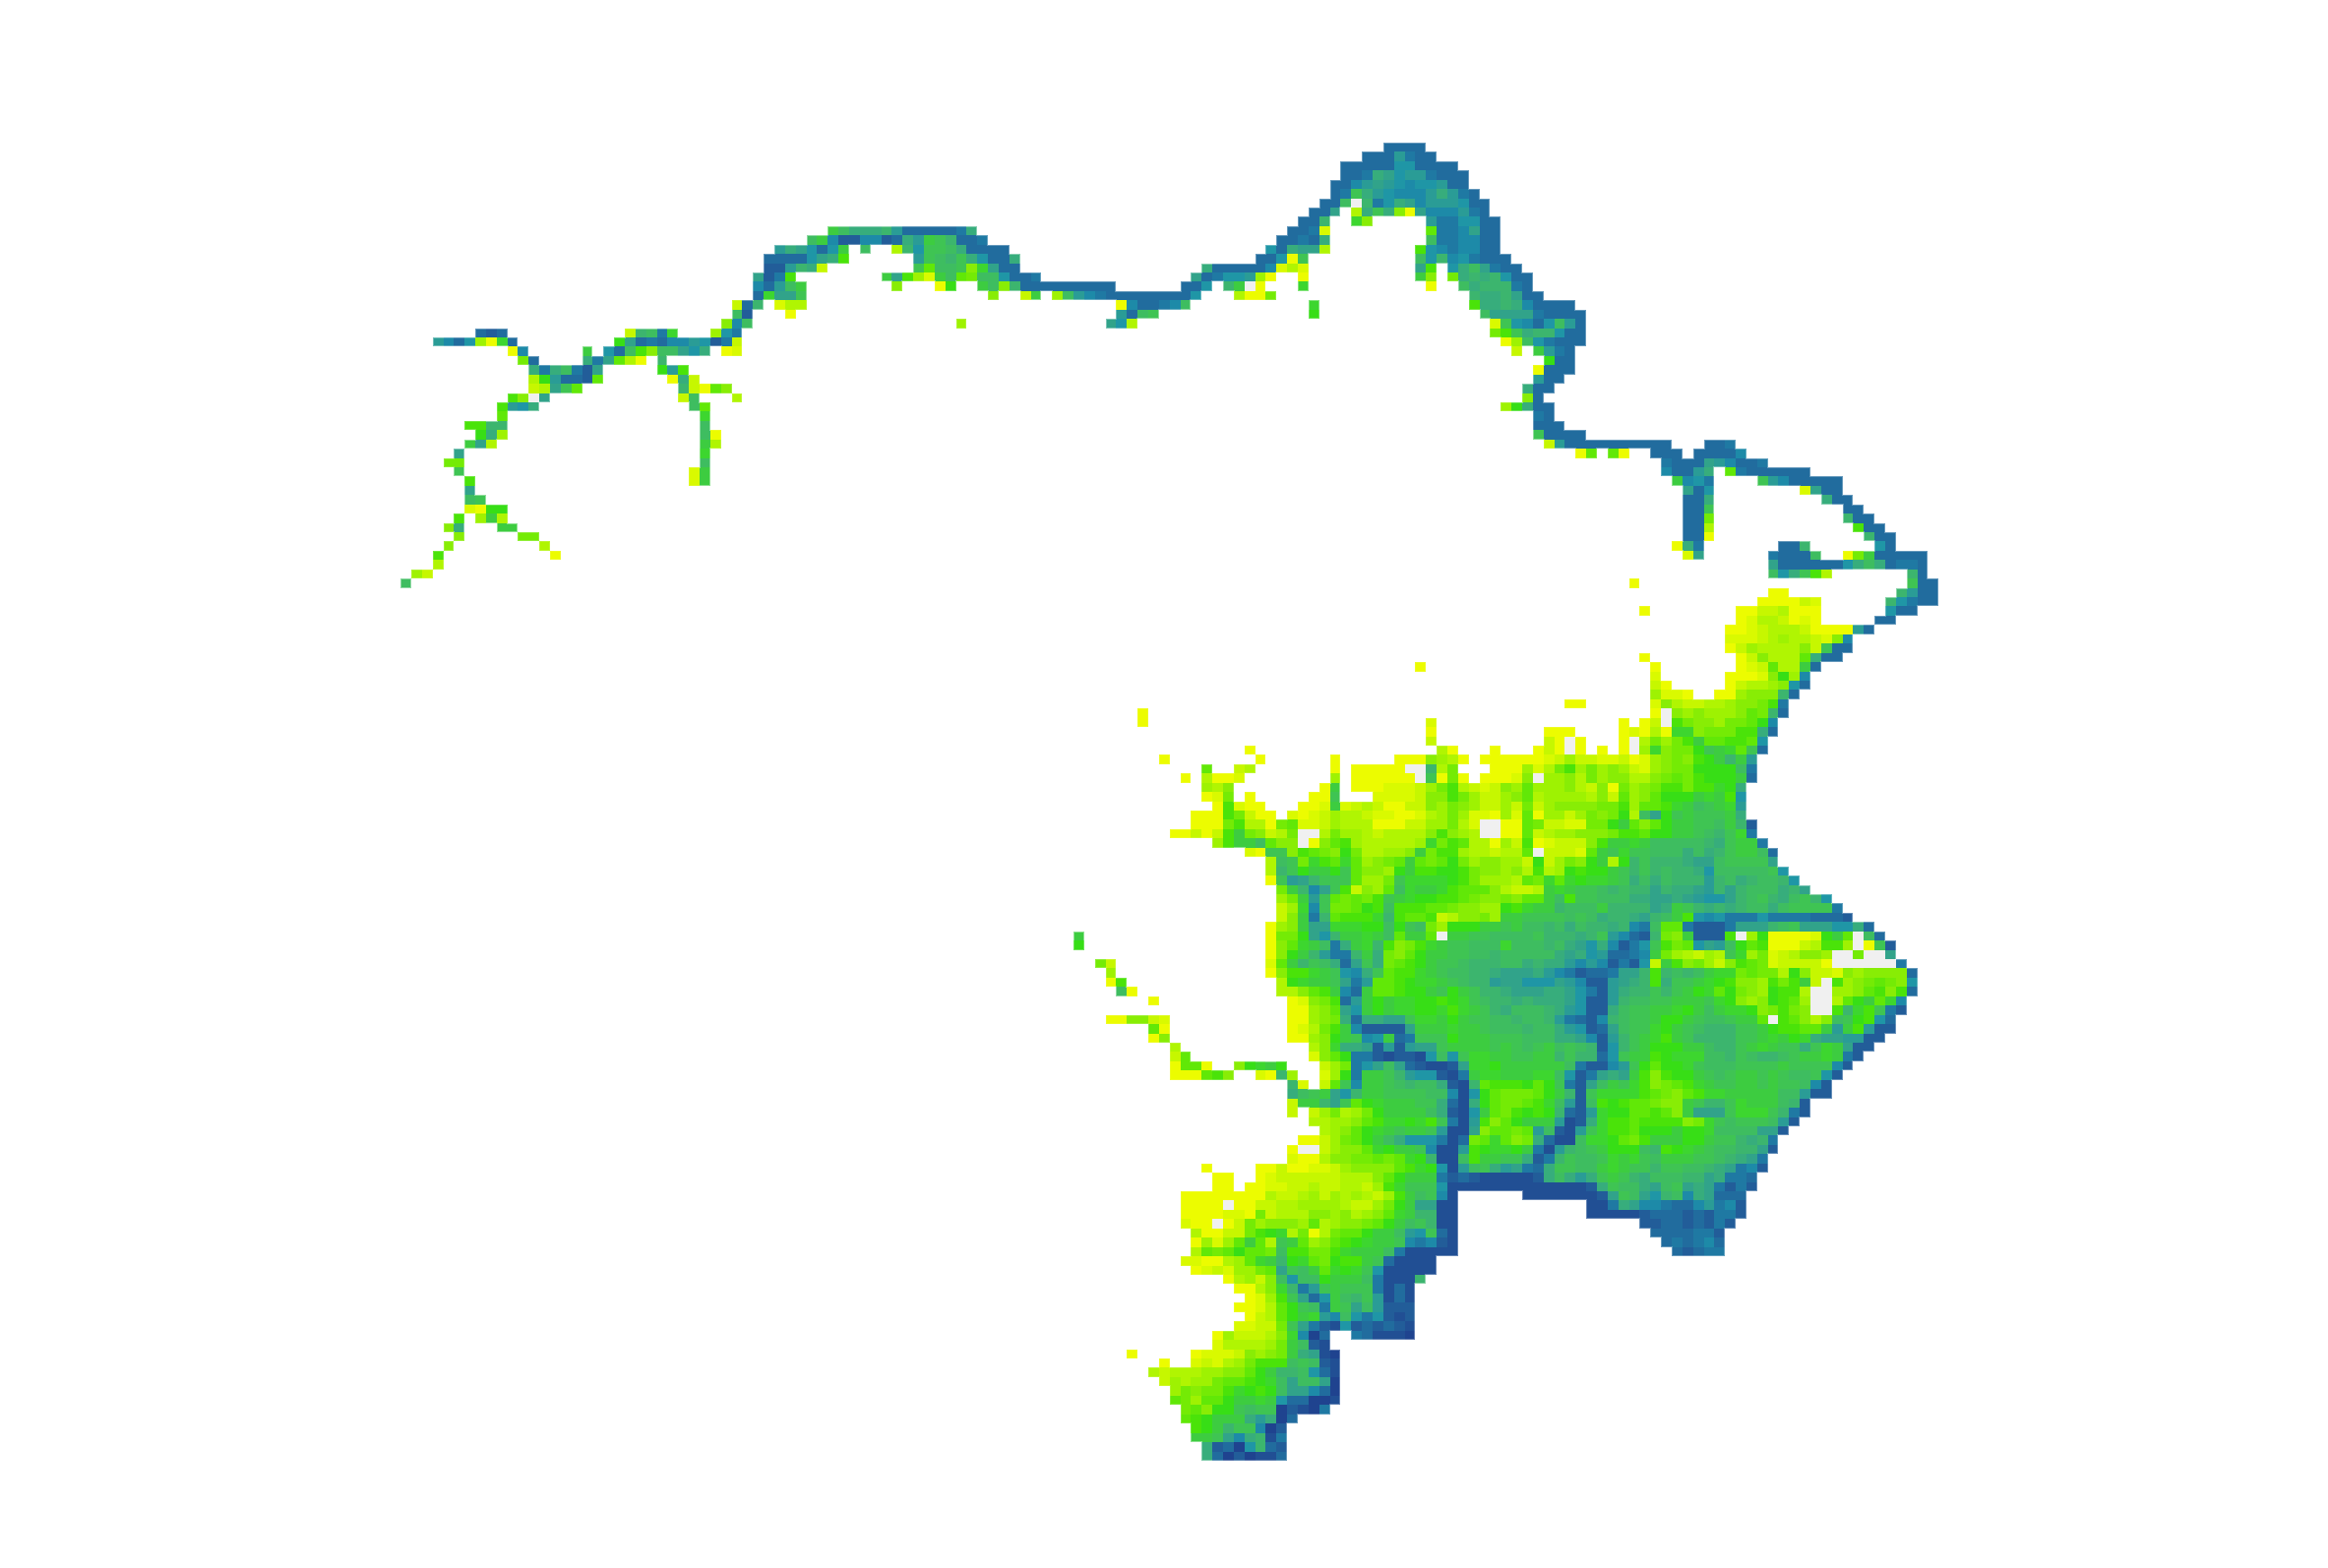

Catchments are nested within larger watersheds and provide a finer scale for analytical data.
Our Storm Surge models used in scenarios are taken directly from the National Weather Service.
See how Sea Level Rises would affect local community.