What is CHARM™?

Community Health And Resource Management™

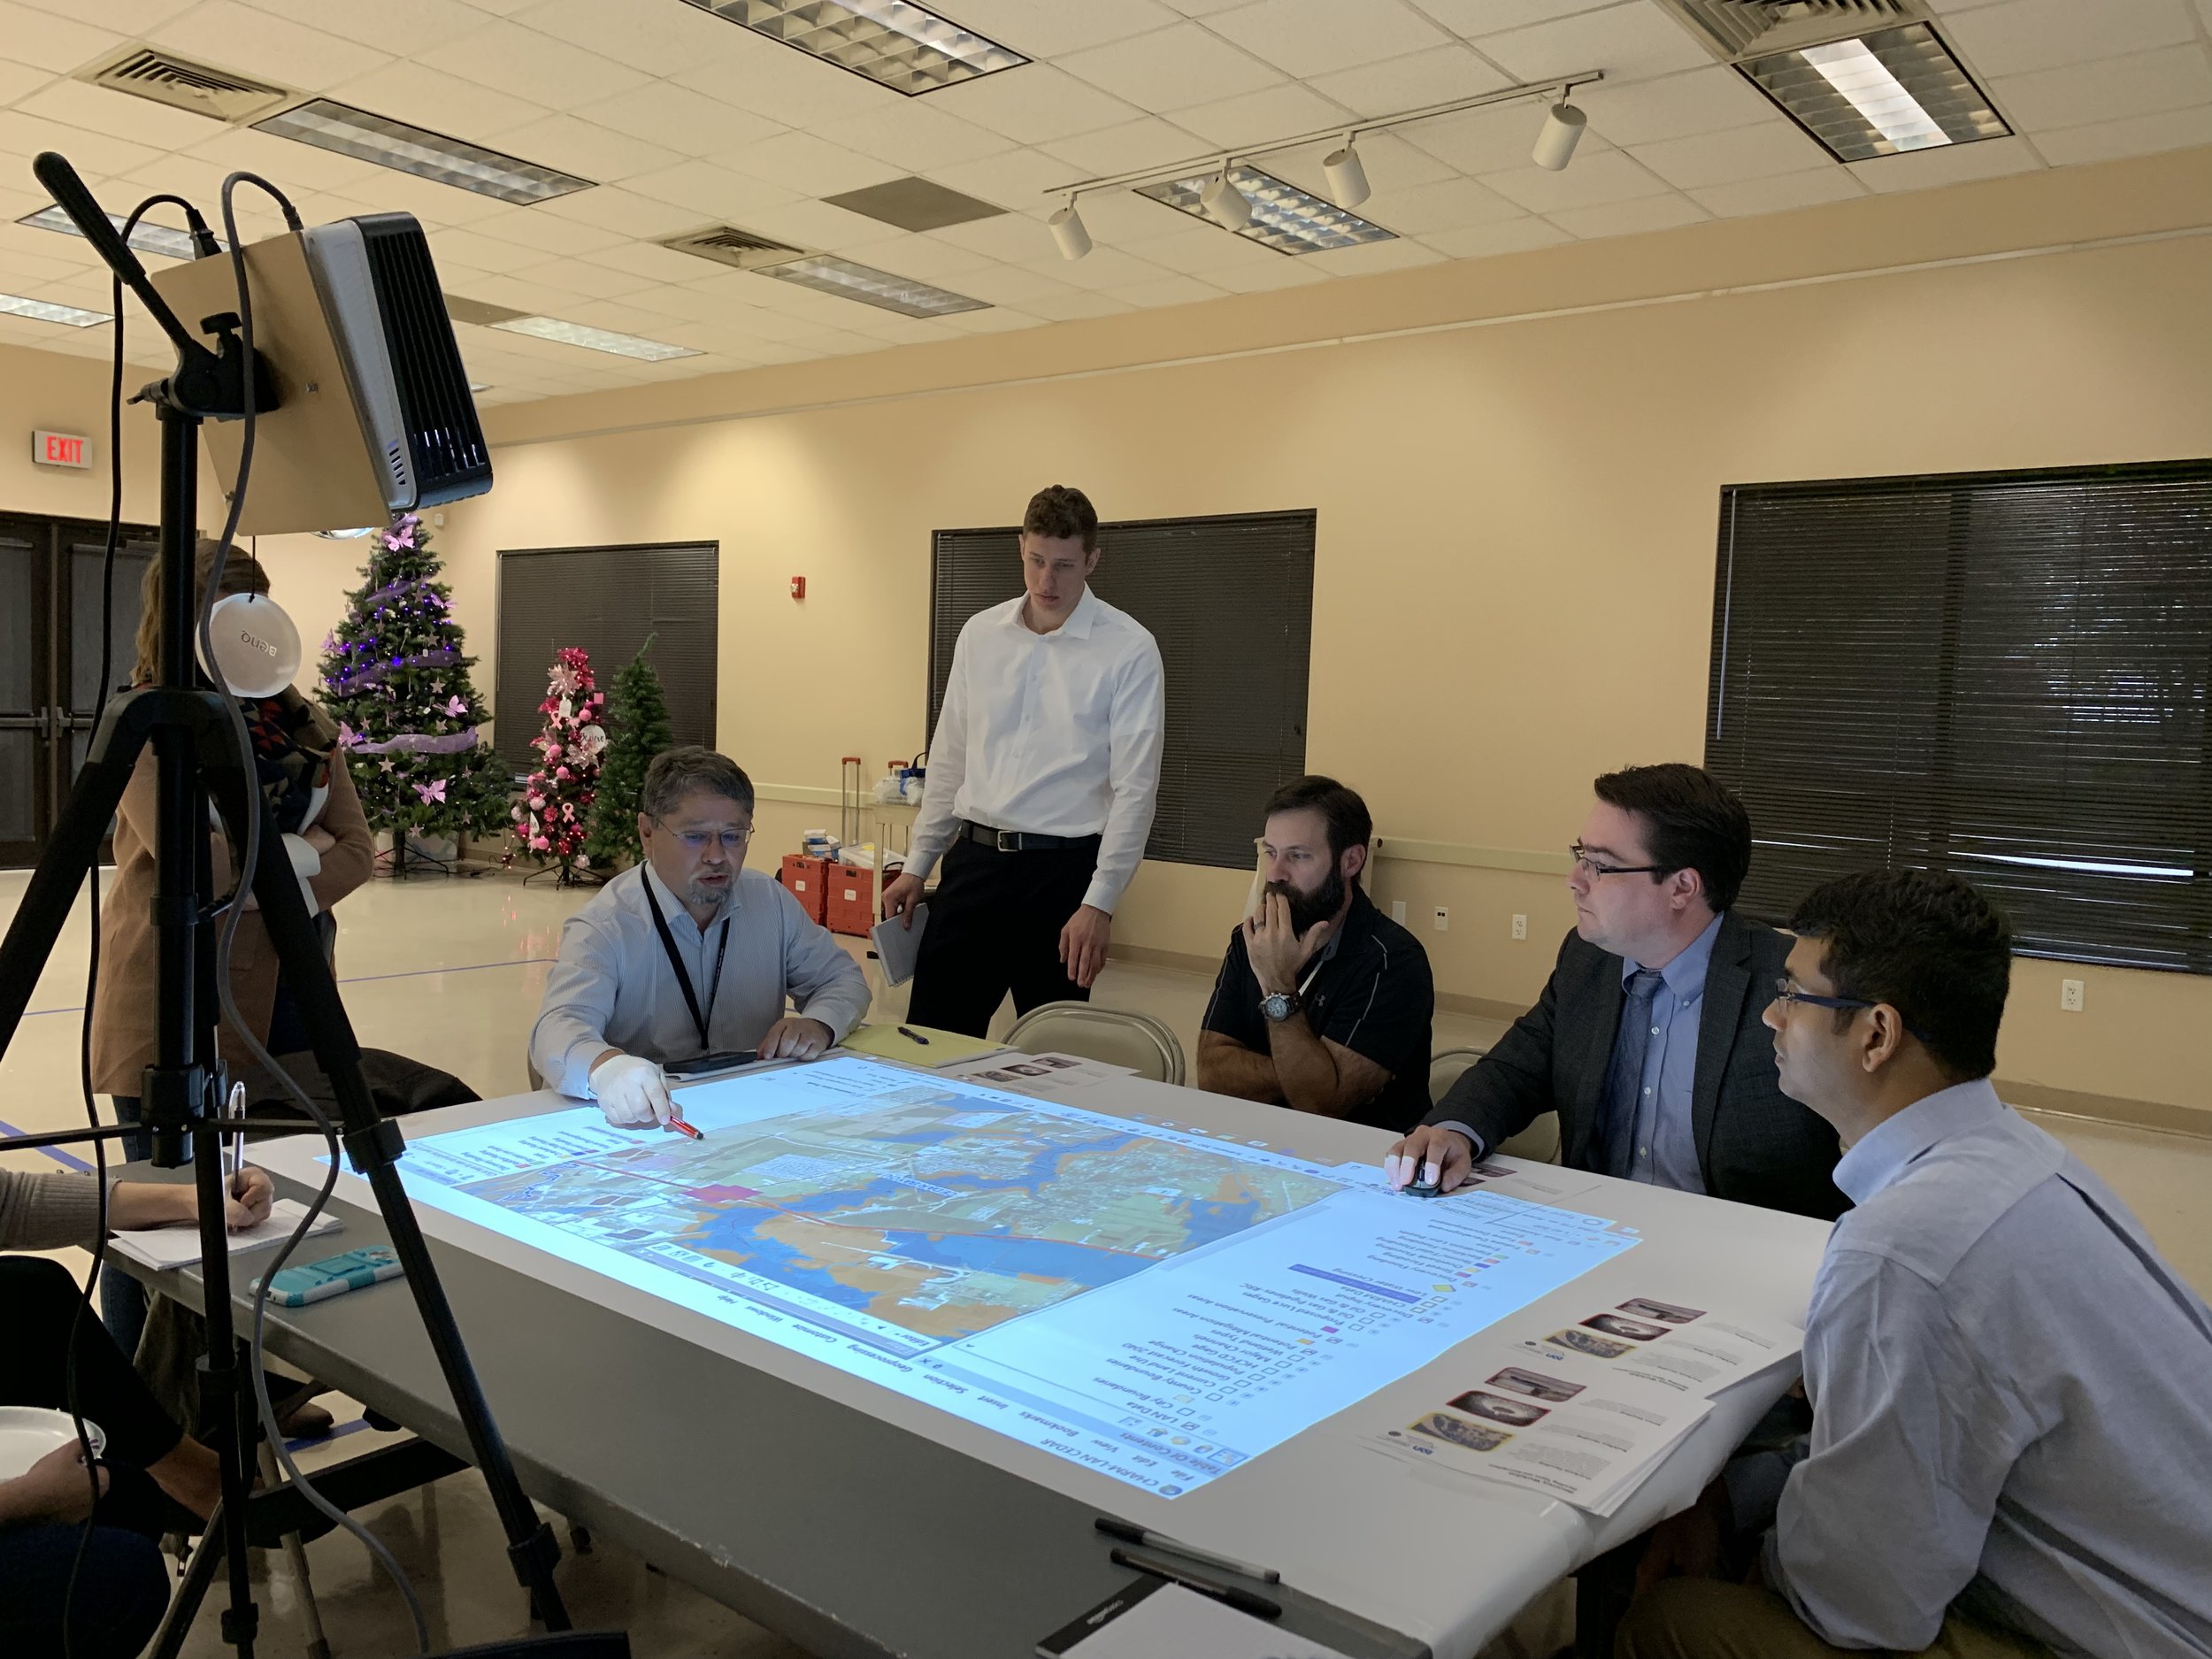
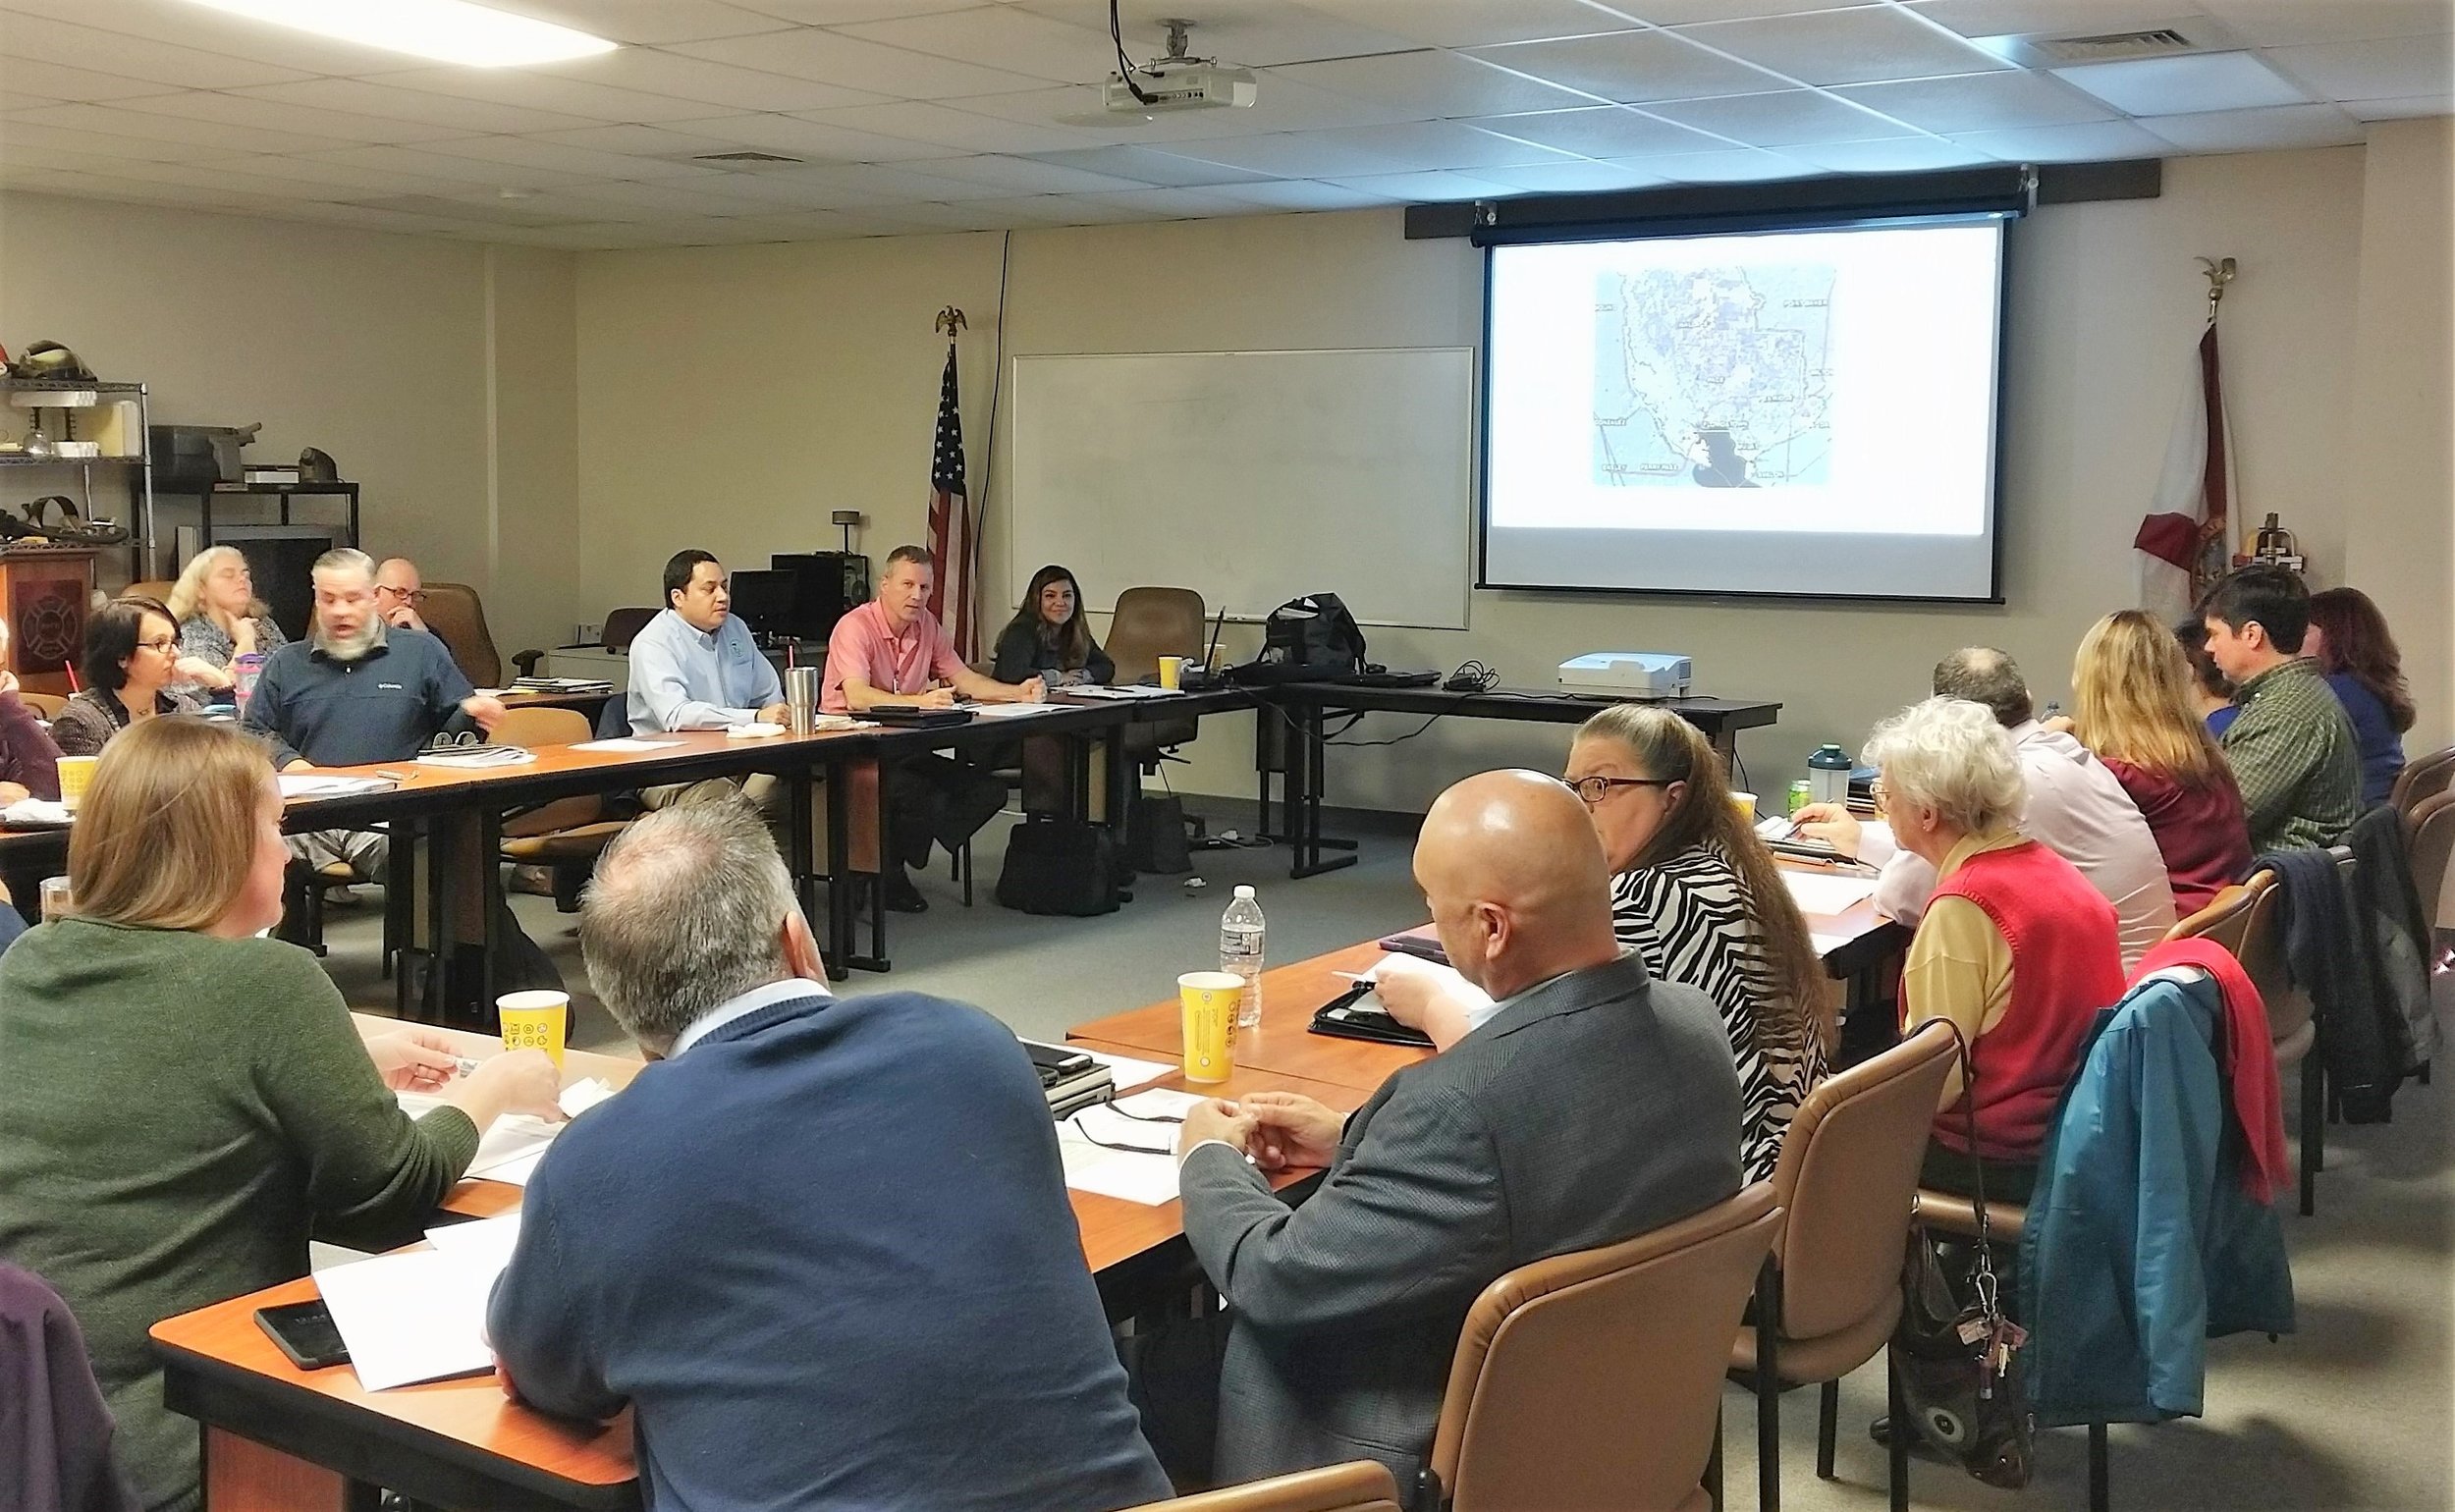
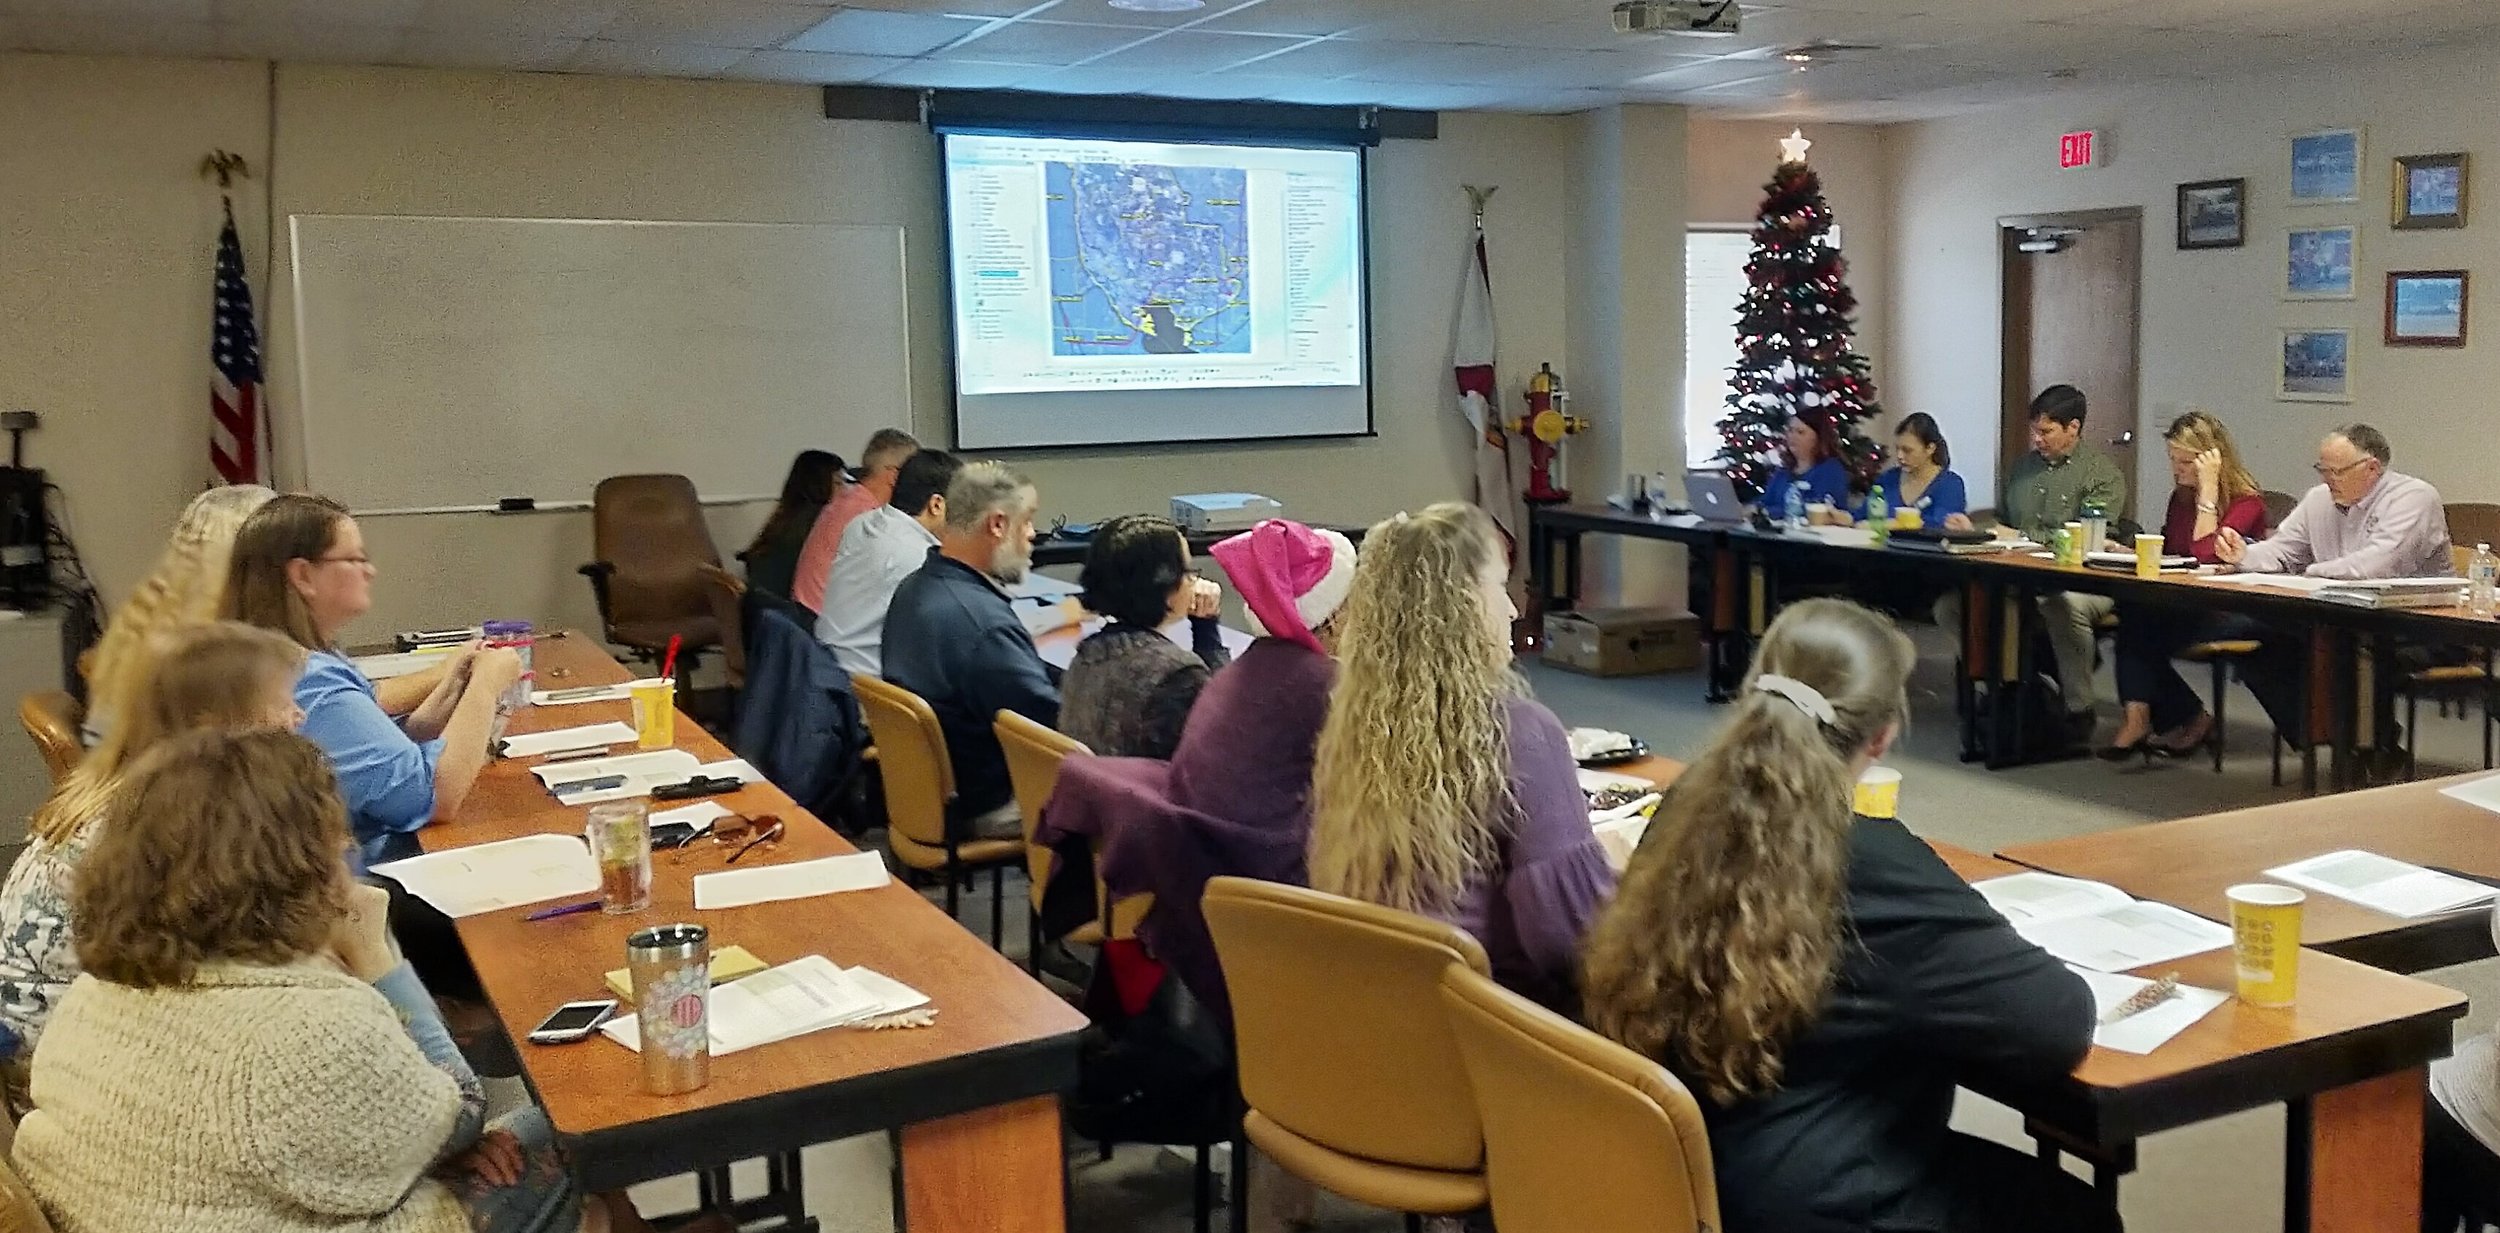
A mapping application that gives local officials, stakeholders, and citizens the power to map and analyze growth with real-time feedback. When used with the weTable, it forms a powerful planning tool for engaging the public and gathering their values about the community’s future. The mapping application is supported with a library of mapping data about urbanization, storm surges, conservation, public facilities, and coastal resources. The CHARM application can leverage local community knowledge for better long-term planning, and is an ideal tool for communities, watersheds, and environmental projects along the U.S. Gulf Coast.
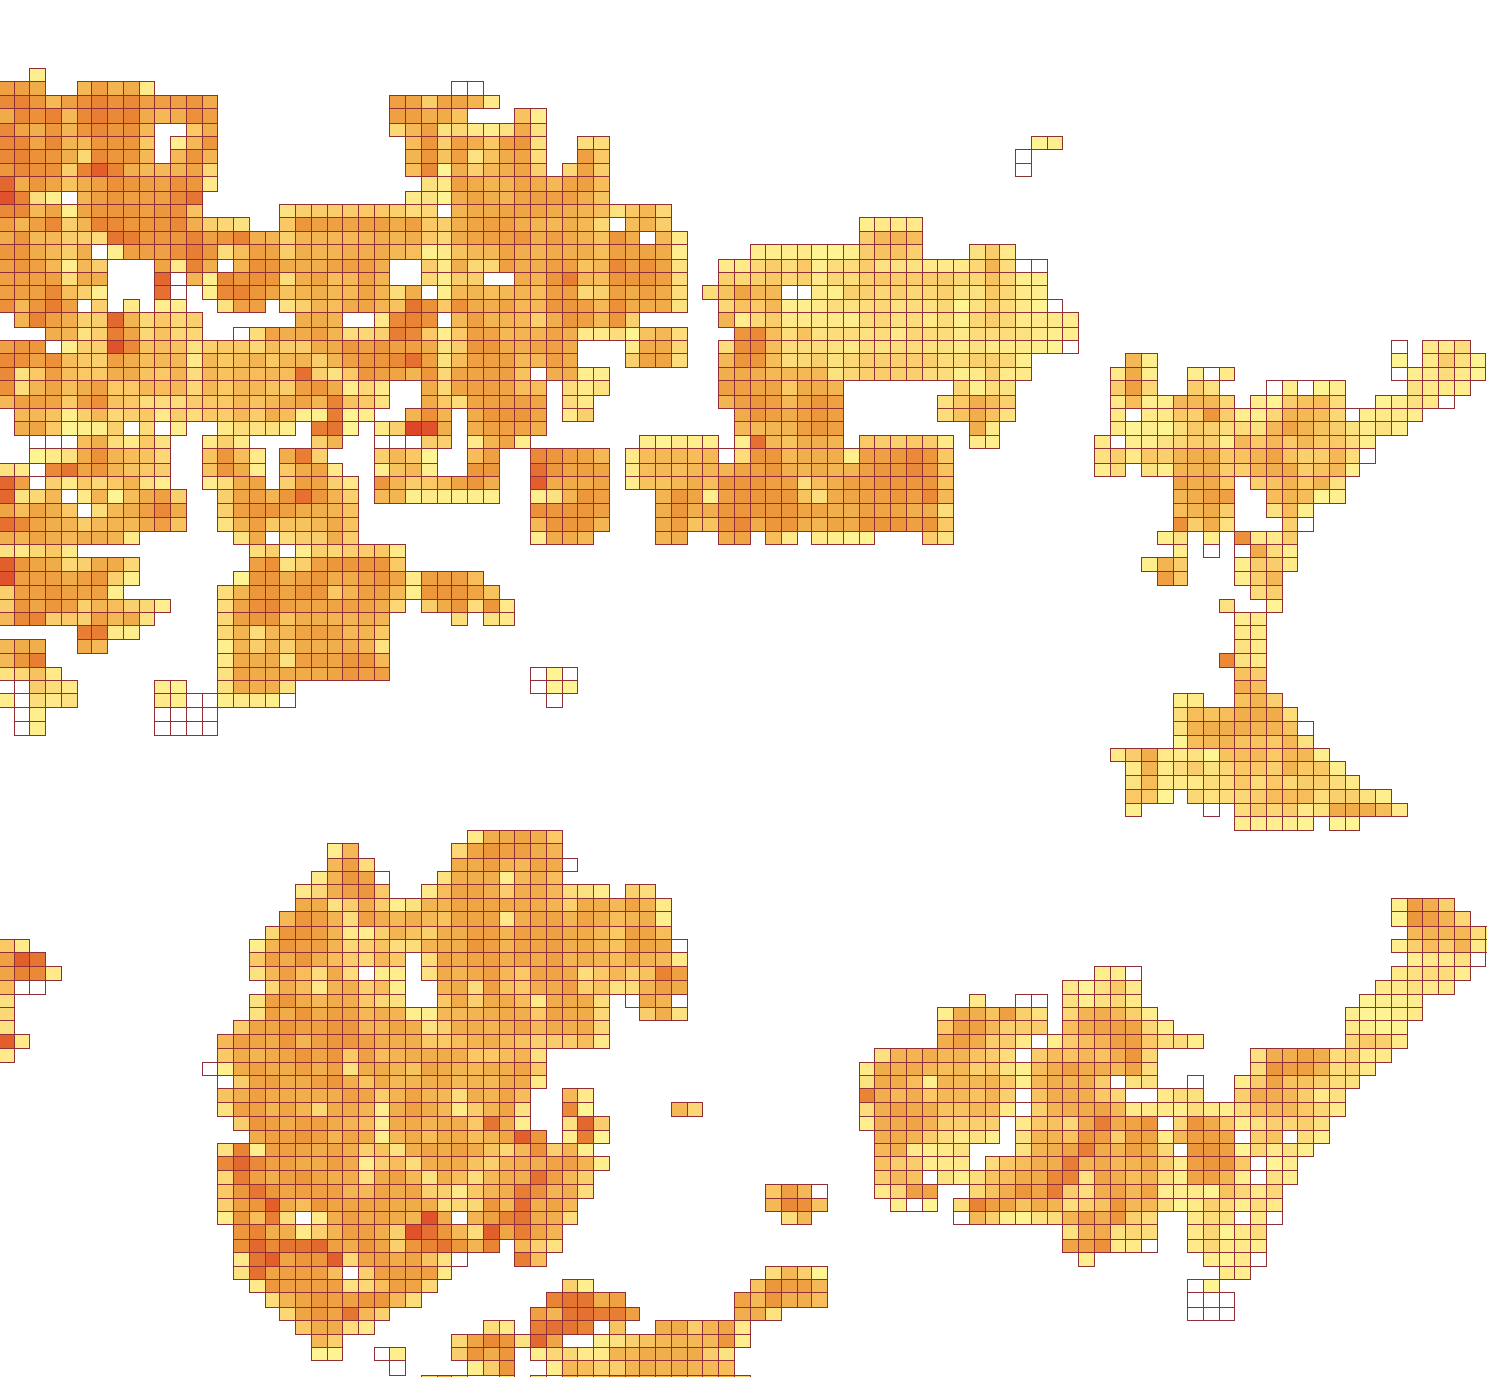
 
Scenarios.png

2.5 ACRE GRID

The interactive CHARM grid layers summarizes 24 land-based characteristics and over 40 scenario-based attributes.
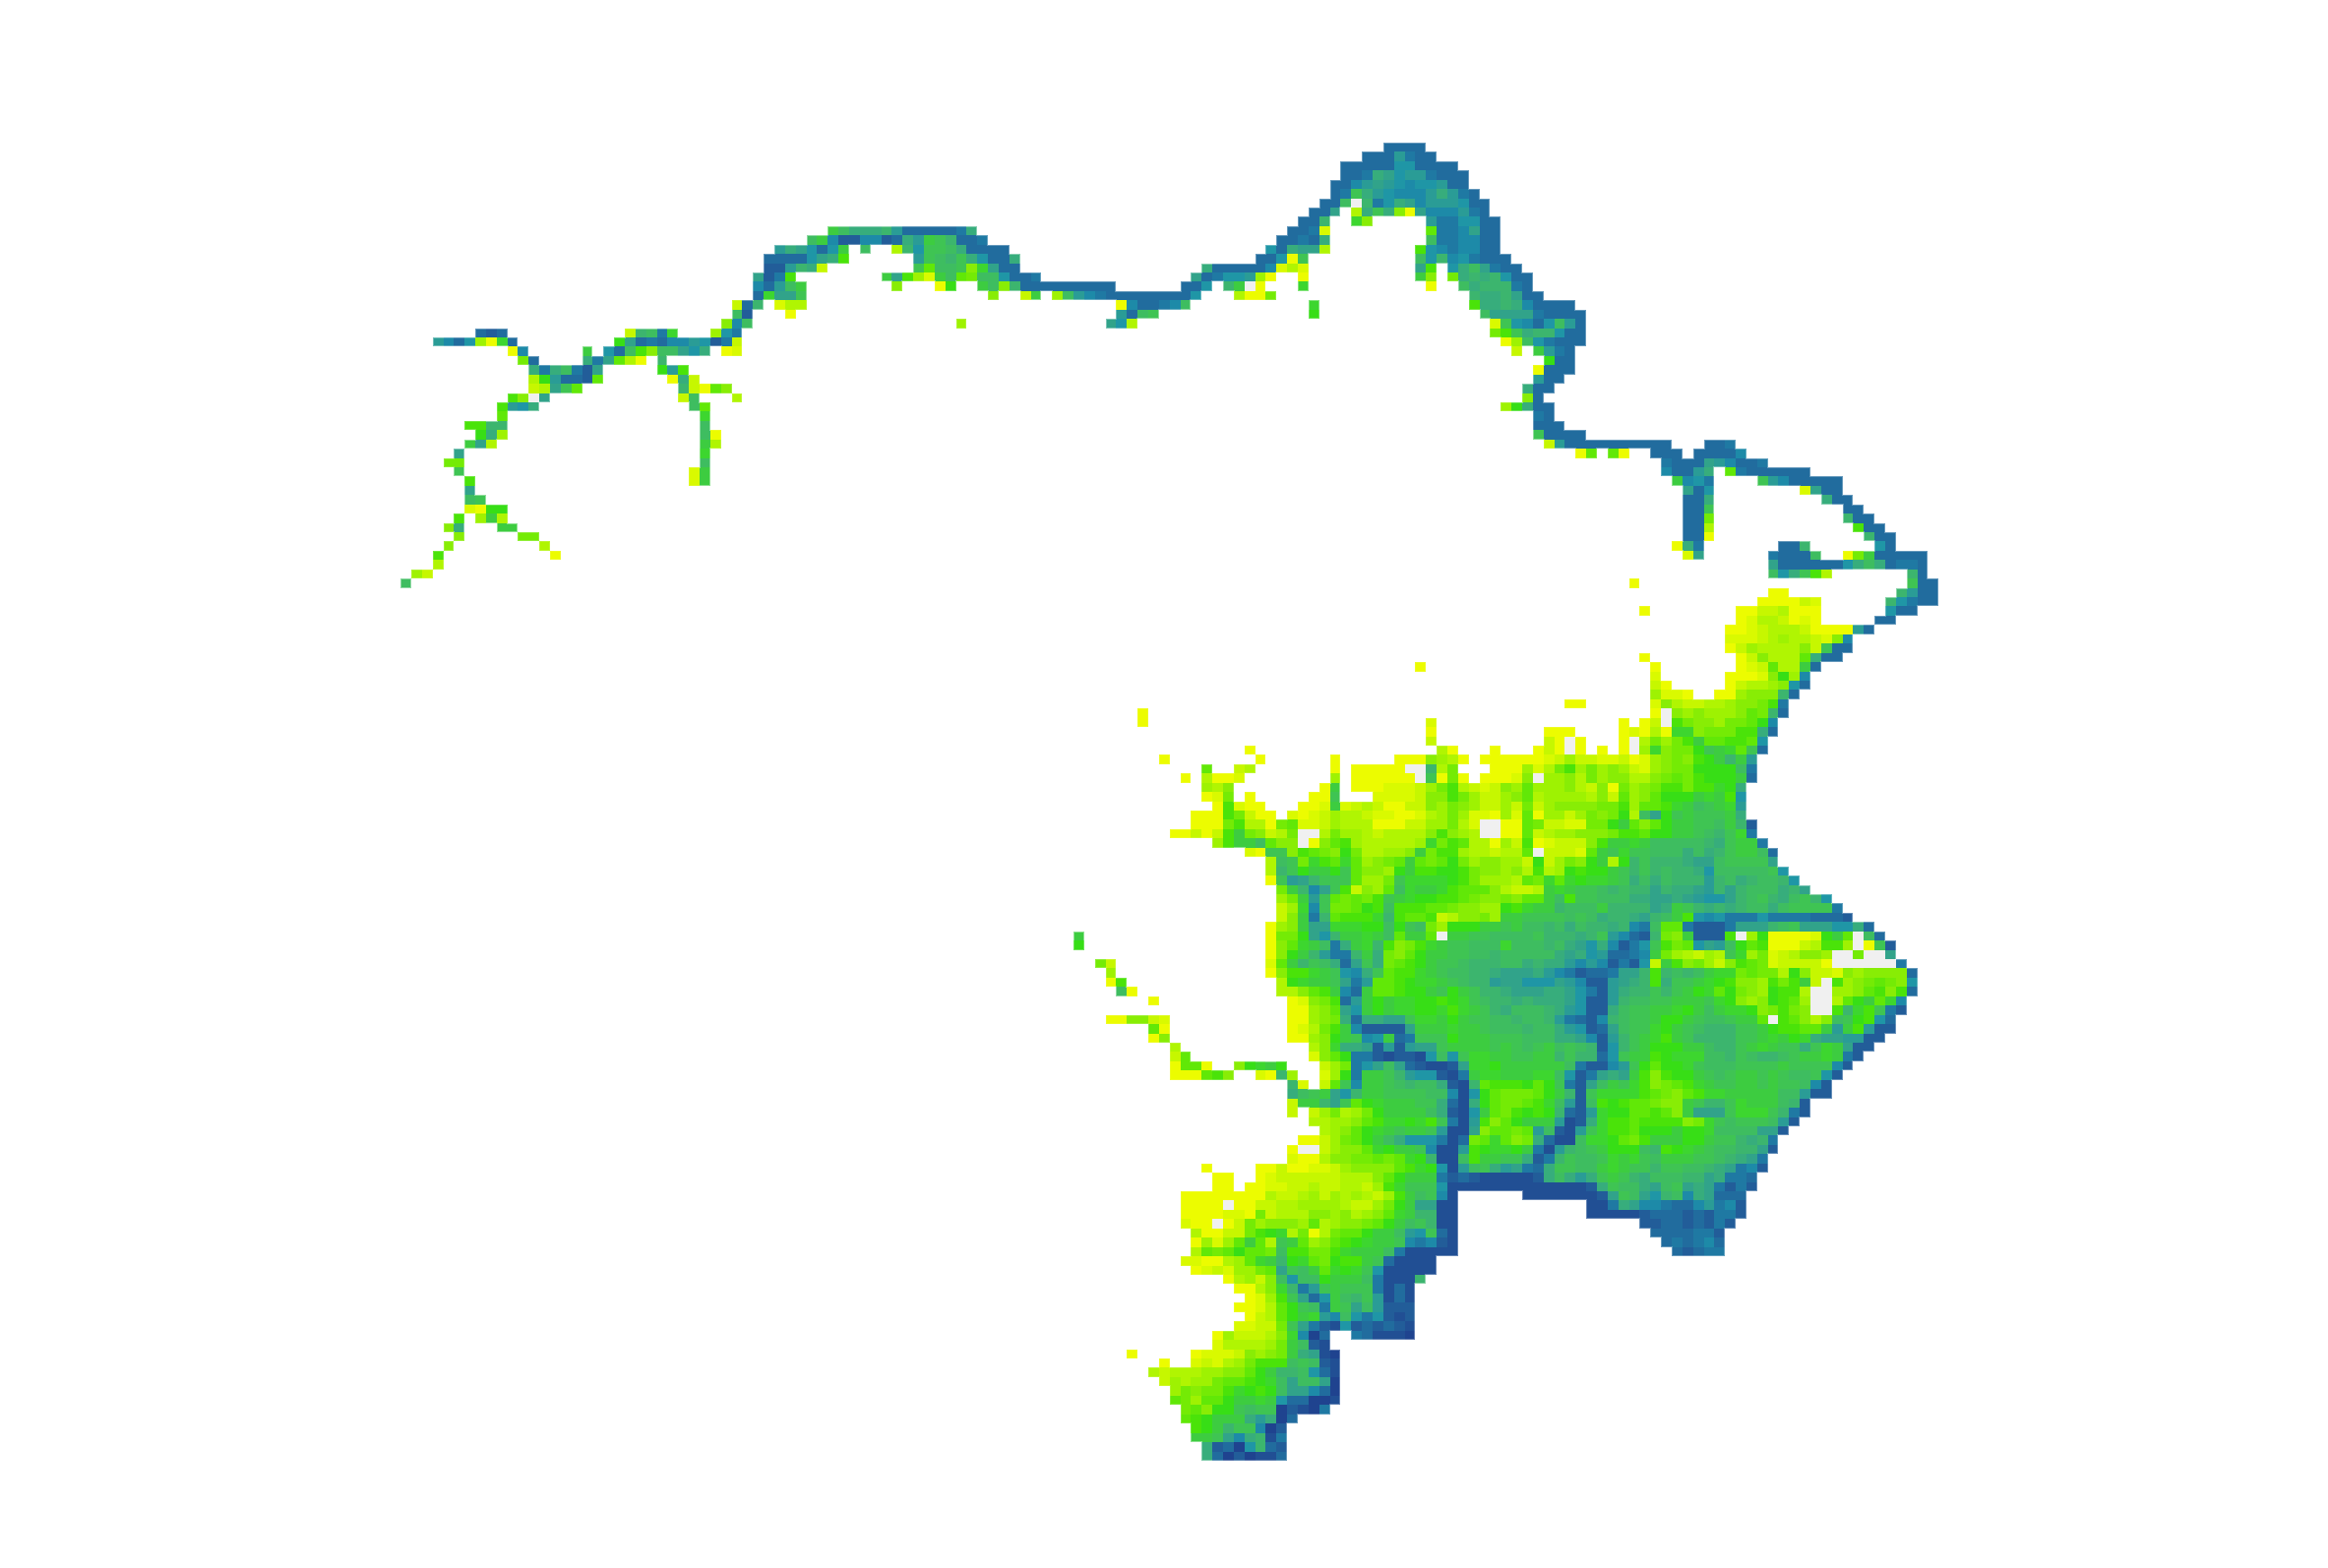
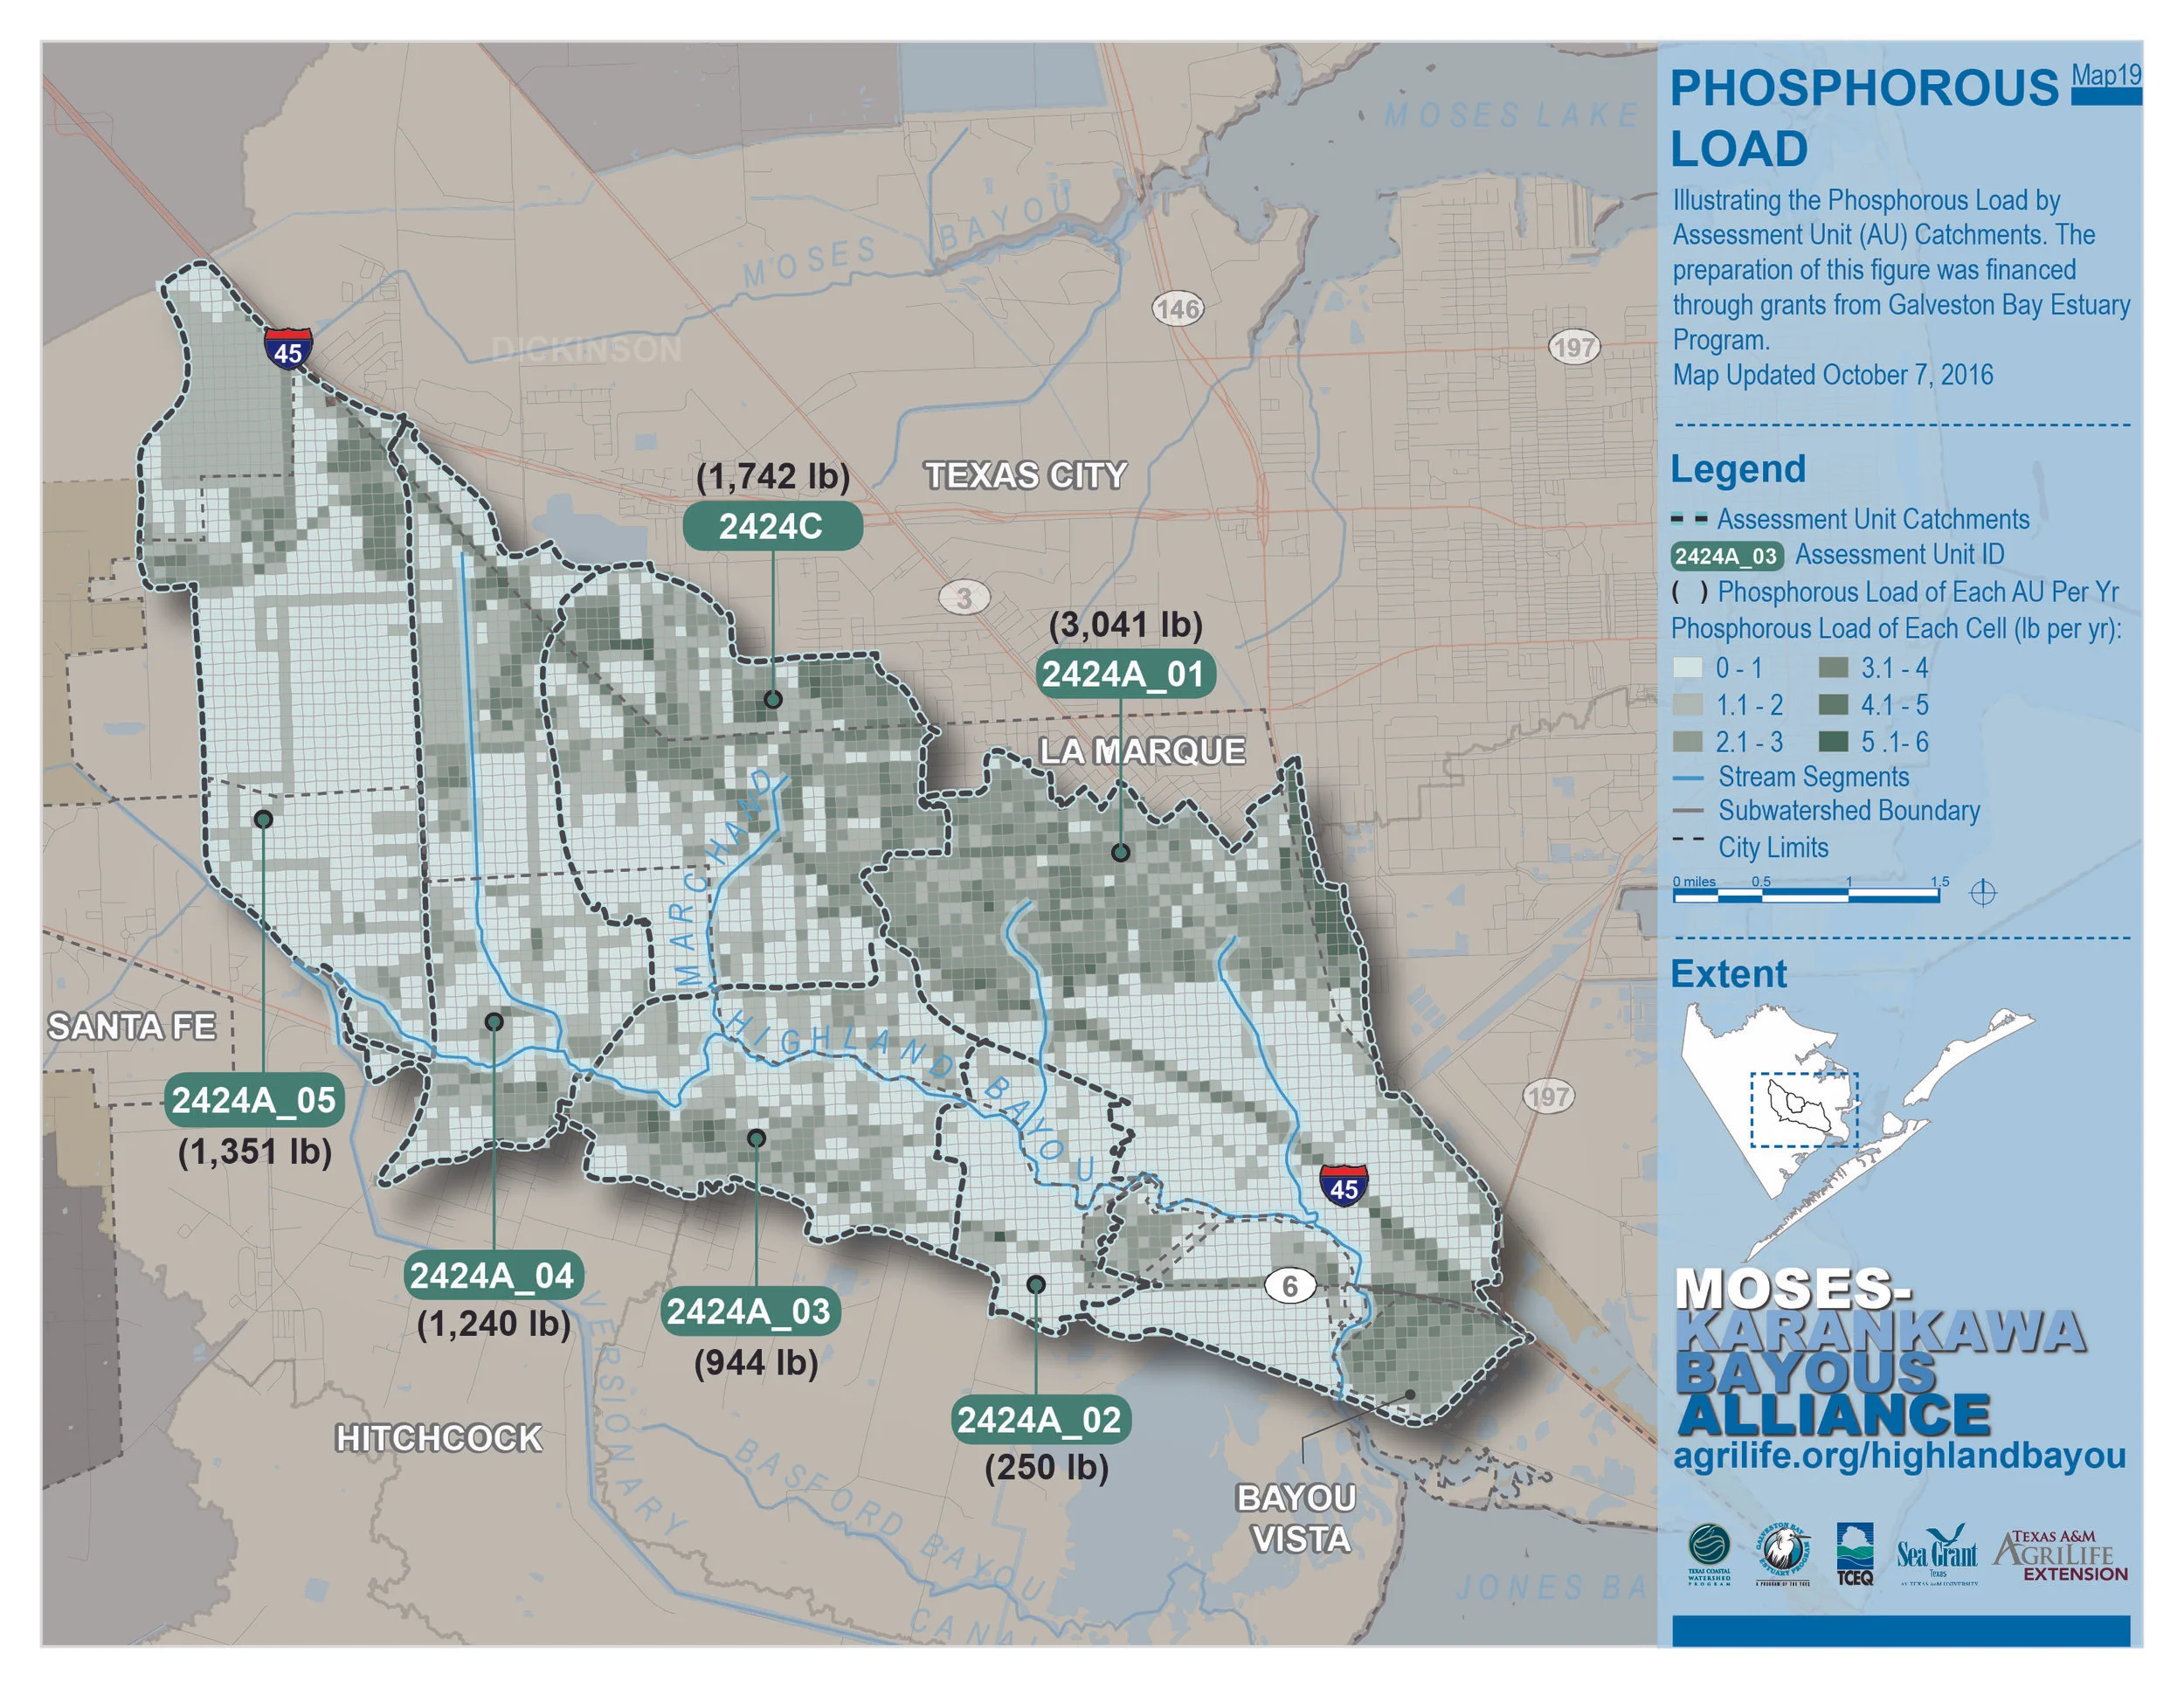
Data.png

20+ MAPPING LAYERS

CHARM gathers mapping layers from federal, state, and regional agencies to inform users on impacts.

paint+legend.jpg

24 PAINTS

Users can build scenarios using over two dozen paints. Each representing a range of development land patterns and usage.
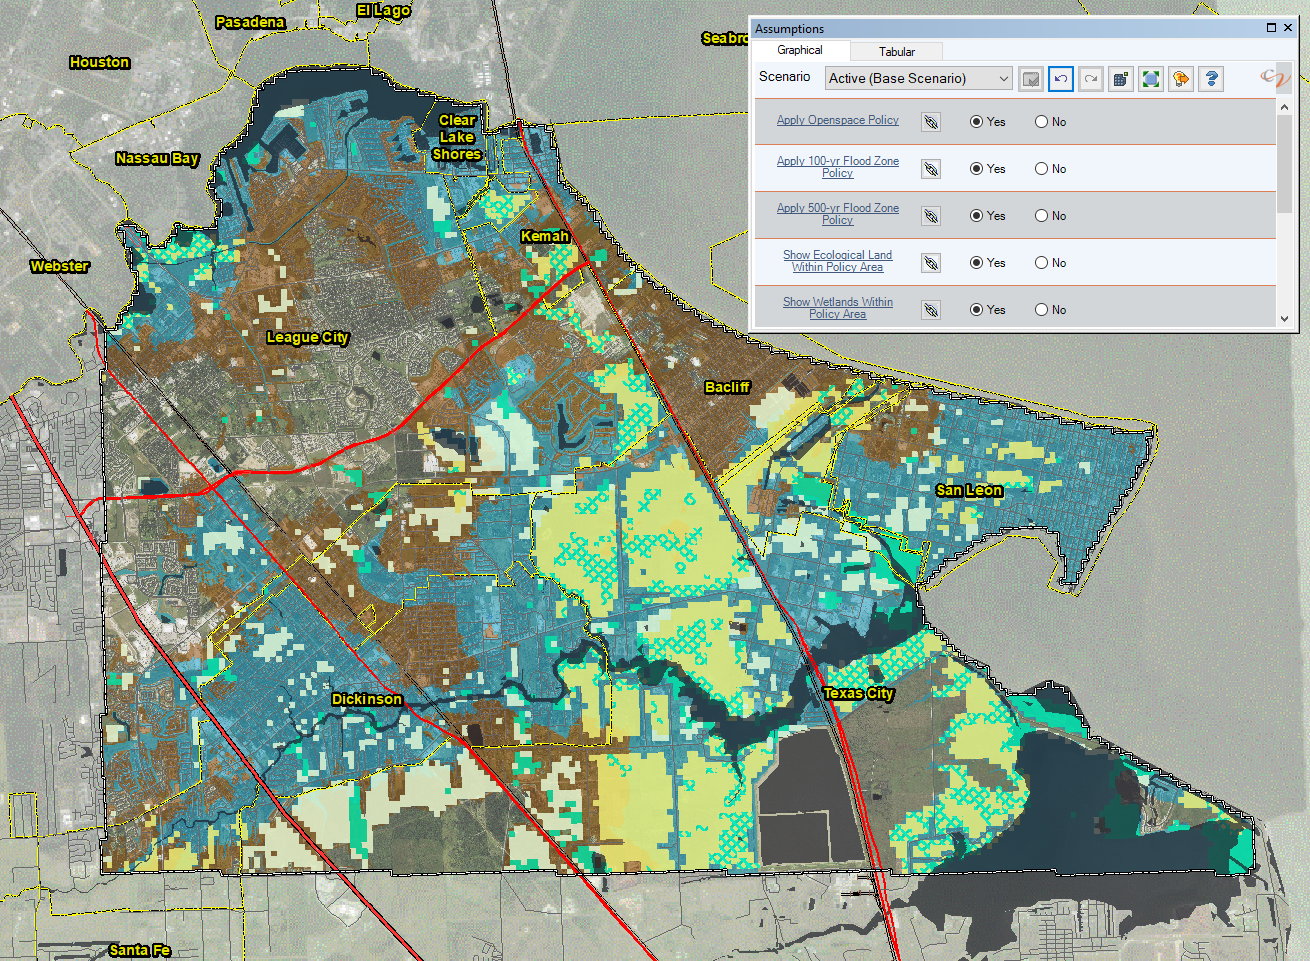
dev.PNG

10+ ASSUMPTIONS

CHARM has the ability to modify certain assumptions about housing, the environment, and costs.

Capture.PNG

50+ CHARTS

Scenario outputs feature quick updates using over 50 charts and graphs to illustrate changes.

Indicators.png

250+ INDICATORS

CHARM tracks over 200 scenario-based indicators about changes or impacts in a community. From habitats to resource use to critical facilities.

CHARM contains a wide variety data for your community.

CHARM pulls together data from local, state, and federal sources to support meaningful dialogue about vision and values for the future. We overlap these data sets and let users apply hypothetical land development styles on them.

See below for more data layer information.


City, county, and state lines are used to identify jurisdiction and municipalities.

Critical Facilites.png

CRITICAL FACILITIES

Critical facilities include public services and other major utilities that might be vulnerable to natural hazards.

Hurricane Track.png

HURRICANE TRACK

These show the past 120+ years worth of tracking hurricane or tropical storm data.

TRANSPORTATION

CHARM GRID

current pop.png

POPULATION

Major roads and interstates under the local, state, and federal classification.

This grid is CHARM’s unit of analysis. Holding over 20 core attributes about land characteristics in the grid, and another 100 indicators once a scenario is created.

CHARM’s data approximates how many people reside in every square on the grid, via census and parcel data.

Demographic.JPG

DEMOGRAPHICS

Gathering demographic data for age, income, and family size.

SOVI.JPG

SOCIAL VULNERABILITY

More demographic indicators that display a specific population’s capacity to respond to natural disaster.

Elevation.png

ELEVATION

Elevation is a key geographical component, particularly with coastal hazards.

Base Flood Elevation.png

BASE FLOOD

ELEVATION

Floodway.png

FLOODWAY

FloodZone.png

FIRM ZONES

BFE displays flood depth at certain points.

Floodways are the highest risk sections of rivers. It’s imperative for planning to know where these are.

The Flood Insurance Rate Map displays insurance zones based on 100 year or 500 year risks.

Flood depth.png

FLOOD DEPTH GRIDS

Within this grid shows flood depths for 100 to 500 year events.

Identifying environmental and other sensitive habitat data in local communities.

Parcel.png

PARCEL

Contact Local Appraisal District

Parcel data assists with understanding land use activity by specific locations.

CCAP.png

LAND COVER

Subwatershed.png

WATERSHEDS

Land Cover marks the intensity of coverage in our communities, such as impervious surface covers.

Soils displays prime farmland areas, septic system drainage, and shrink-swell potential.

Since everyone lives in a watershed, it’s important for understanding how development impacts stormwater issues.

Catchment.png

CATCHMENTS

Surge and SLR.png

STORM SURGE

SeaLevelRise.JPG

SEA LEVEL RISE

Catchments are nested within larger watersheds and provide a finer scale for analytical data.

Our Storm Surge models used in scenarios are taken directly from the National Weather Service.

See how Sea Level Rises would affect local community.

CHARM PROJECT EXAMPLES


Resiliency Workshops

FEMA is seeking ways to engage communities about risk awareness and to build hazard mitigation into local plans and policies. CHARM is helping these communities have that conversation. Since 2015, CHARM workshops have been held in twenty counties, attracting over 760 stakeholders representing dozens of communities, agencies, and organizations. More Texas counties are on deck for Resiliency Workshops in 2019.

(View More)


lan-logo.jpg
0fIcW3VM_400x400.jpg

CHARM Discovery workshops (LAN/HCFCD)

In November, 2018 a flood risk mapping workshop was held in Harris and Chambers counties, co-hosted by LAN Engineering and Harris County Flood Control District (HCFCD). CHARM was utilized as a platform for community stakeholders to identify and record where flooding has been observed in the past. This information from watershed stakeholders will then be used by engineers in a multiyear project to update local flood insurance rate maps.The mapping exercise focused on three watersheds- Cedar Bayou, Jackson Bayou, and Luce Bayou.


Community Resilience Index (CRI) with CHARM Pilot

In late 2018, a pilot CRI-CHARM workshop was held in Santa Rosa, FL in partnership with FL and LA Sea Grant programs. A standalone CRI workshop includes working with community leaders to examine how prepared they are for storms and storm recovery. By adding CHARM to the assessment, the community was able to identify weaknesses in their plans and community facilities. Due to the success of the pilot workshop, CRI-CHARM workshops could be coming in the near future.  


No Adverse Impact

ASFPM is working to help communities and professionals improve development practices through the framework of No Adverse Impact. As part of a day-long continuing education workshop ASFPM and TCWP have been working in partnership to bring a joint NAI-CHARM workshop to communities, including Biloxi, Mississippi in 2017 and New Smyrna Beach and St. Augustine, Florida in 2018. CHARM data was used to spin up new table-top scenario exercise specifically for these communities, providing a highly detailed, localized scenarios. Local stakeholders collaborated to think about growth, hazards, and community needs while utilizing FEMA’s Risk Map data and other local data sets.

(View More)

➜ LEARN MORE


Citizen Planner

Summer 2019, Citizen Planner will be hosting planning courses for local officials and focusing on hazards reduction. The training will utilize the CHARM platform as an interactive exercise for Citizen Planners to put their knowledge to use. This builds upon the success of the 2013 and 2017 Citizen Planner programs, a planning education program geared to local officials and staff about planning practices. Also this summer, the program will unveil an online virtual Citizen Planner program.

(Visit Website)


Highland Bayou Watershed Protection Plan

The Galveston Bay Estuary Program in partnership with the Texas Community Watershed Partners utilized CHARM in a watershed protection plan to estimate non-point source (NPS) loading in the Highland Bayou Watershed in Galveston County. The grid’s baseline data along with assumptions for pollution loading rates and other values allowed the project team to quickly update NPS loading in the watershed.

(View More)